Your data warehouse is set up. Your data is being cleaned according to your carefully thought out design. You have governance agreements in place with all the key stakeholders. Your systems integrations are complete. Your jobs are running as planned and scheduled. You have started to produce business intelligence reports and dashboards and everything looks great.
Then reality sets in. You hear about bugs. You hear about flaws. You hear about missing data. There are days when there is no data at all. And all of these data analytics issues need fixing immediately because the organization has become completely dependent on your tools for its daily operations. How can this be happening?
Often, the interactions between the many necessary upstream data sources and services are the culprits. These can be complex and full of hidden and not-so-hidden pitfalls. Furthermore, in any organization, data definitions can vary from one group to another, and the data landscape can change throughout the cadence of a year, introducing unique design challenges.
In the work we do at Unicon, we encounter clients that face data analytics issues like these every day, and we support them to find solutions. Below are a few of our experiences to give you an idea of pitfalls you might encounter and issues you might want to consider on your own data journey.
What time is it where you are?
Why wasn’t this working??!!?? Every morning, the table of currently enrolled students in the dashboard under development was completely empty!
It made no sense–the query for it seemed very straightforward. It selected students from a daily students table that was updated every morning:

The date_key in the daily students table represented the current day’s date.
The job running the query ran at 9 pm at night—at which point the student table would have had the current day’s students and date_key for 14 hours.
WHY wasn’t the query finding any students??
The answer was very simple once you knew it:
- The server hosting the client’s business intelligence software was set to UTC.
- The job updating the student table was using eastern time.
- Every day after 7 pm EST and 8 pm EDT, GETDATE () in UTC would be finding “tomorrow’s” date –which didn’t yet exist in the student table!
The solution? Appropriate scheduling of the job running the query so GETDATE () would already exist in the student table when the job ran.
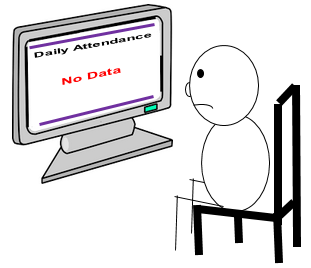
Here’s another example. It was the Monday after daylight savings time ended, and the reports were rolling in from across the district that the attendance dashboard still had Friday’s data. No changes of any kind had been made that would cause this to break. Why wasn’t this working?
Once again, time zone and UTC were the culprits. The school district finalized attendance data each morning at 10 am and required that the daily attendance dashboard be available by 11 am. The job pulling data for the dashboard was set to run at 10:30 am. But the server running the job was in UTC, and after the switch from daylight savings time to standard time, it was running too early and pulling data before the day's attendance was finalized. The solution? Reschedule the job and make a recurring task in the task management system to do this each time the clock changes.
Differing time zones across servers and systems can present significant scheduling and data alignment challenges. They are definitely something to take into consideration, particularly in the spring and fall when the clocks change.
Beware the tight integrations…
One morning, all the major dashboards showing data for the current day were blank or showing data for the day before. Alerts showed that the job populating the daily student table had failed and the table had no data for that day! However, no changes at all had been made to the table or any job associated with populating it since the previous day. Why wasn’t it working??!!??
When the database schema was originally designed, many of the text fields were specified to be the exact length of the data they were expected to contain. This was carefully planned and worked well–until the upstream system changed its reporting to send data that was one character longer in one of the fields, causing the job to fail and not update with the current day’s data.
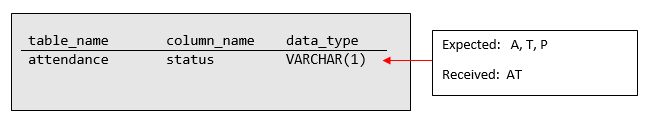
The quick solution? Update the field to allow a much longer text string and do the same for other fields in the schema to introduce more flexibility.
In an ideal world, your data organization would have a well-documented data dictionary and schema. Your ingestion layer would have a set of tests that could alert you before they hit your transformation jobs. You would expect to receive detailed release notes about changes in the data from all your upstream systems and have enough time to review and thoroughly analyze the impact of any and all changes.
In reality, your ingestion layer and transformation jobs may be the same. Time constraints exist, knowledge bases are incomplete, institutional knowledge has gaps, and with all the best intentions, decisions can be made with no idea that a design created years previously will break as a result.
Schema design for data that is coming from an external source is tricky. Tight column constraints, such as the maximum number of characters allowed set to the exact number expected, or maximum values set on number fields that seem like they “should” be less than a certain value, are risky. Building some flexibility for future data change or data that doesn’t always behave the way you expect can be a worthwhile tradeoff for the performance benefits or space savings of tightly constrained schemas.
Looks can be deceiving…
Another day, another bug report. The table reporting free or reduced price lunch statuses had inaccurate counts. This table was generated from two sources. One source was internal, derived from forms completed by students. The other source was the school district’s city-wide data repository. This data repo was big, official, documented, used by every district in the city.
After laborious tracing of what was going wrong, we discovered that the supposedly “unique IDs” provided to us by the city were in fact not unique at all. IDs for students who had aged out or left the system were being re-used. But we weren’t aging out or removing students from our system, so the resultant overlapping IDs caused overwrite and data loss for one of the ID users.
It’s amazing what you will find in an upstream system–even when that system seems like it should be well-crafted and reliable. Making assumptions about upstream data based on the information that the system provides and building your data plan from existing documentation can definitely result in discrepancies. Much better to do a thorough analysis and investigation of the data yourself as you incorporate it into your data design.
A validation of the key fields necessary for analysis at the beginning of a project is worthwhile and will end up saving time in the long run. Further, the work you do through the review process will provide a valuable asset to the data designers as you update the documentation and provide outside validation of the key fields from each organization.
The future definitely happens
The plan to generate an academic performance index to serve as an early alert system for identifying academically at-risk students based on test scores seemed like a great idea. Resetting each student’s academic performance index with the first test of each new school year seemed like a good idea too–new year, new material, a good time to re-evaluate.
The academic performance index was rolled out in the middle of the school year after extensive testing and analysis of whether it was accurately predicting struggling students. It was very well received and many processes were developed around using it. However, when it was reset after the first test of the new year, most of the previously at-risk students now showed as performing the same as their peers–not at risk at all.

After investigation, we learned that the first major exams of the school year for grades K-8 were special kinds of tests graded with only four scores, and most students received either a 75 or a 50. This was not sufficient to provide a true picture of who was struggling relative to their peers. For this specific test type, we needed to redo the methodology for assessing the academic performance index, working under considerable time pressure given the importance of the index to the organization.
In the end, it all worked out. But a better scenario would have been for the design team to have subject matter experts (SMEs) who could help identify use cases for the academic performance index’s critical touch points throughout the cycle of the school year. Then the data team’s design could have allowed what-if scenarios at any point in time throughout a school year, including at the time of the first exam.
A similar scenario occurred with report cards. Through the first two quarters, the high school report card dashboard looked great, accurately reporting high school course grades and overall grades for each quarter and year-to-date. Everyone was confident that Quarter 3 would go smoothly! Two days after grades closed and the report card review started, we learned that this was not going to be the case. Course grades were still accurate, but the overall grades were not. The data structure design was not properly handling half-year courses that were taken in the fall semester. Their grades were supposed to be included in the overall averages, and they were missing.

The solution involved a complicated workaround in the dashboard’s logic layer to get the required data from the data structure, as well as a request to the engineering team to update the data structure for the future.
It’s important for any data project design to consider what will happen as data changes throughout the year. Ideally, there would be a comprehensive set of use cases that encompass the entire life cycle of the project. At a minimum, the design’s use cases should address the most critical points that occur during the cycle. Successful testing requires a flexible data set that can be constrained to represent the data conditions that exist at each critical point so that the results can give stakeholders a true idea of the outcome of the project.
Planning for data change
Although the initial release of the academic performance index was a success, after a few weeks, we began to get reports of it changing arbitrarily. Everyone knew that it was based on major test results, and everyone could see the students’ indexes. The problem was, it seemed to change on days when there were no new test results. How could this be happening?
The basic reason was back-dated test grade changes. These happened for a variety of reasons:
- The student was absent, and the teacher had originally entered a placeholder score.
- The test had manually entered scores for all students, and some of the scores had typos, which needed to be corrected.
- Some of the scores did not come through from the source system when the test was originally taken.
After some analysis, experimentation, and consultation with stakeholders, we introduced a delay of one week so that the academic performance index would not be recalculated until after the scoring had settled down. A similar issue occurred on a much smaller scale with attendance. In this case, the adjustment was to add a late-day refresh to the attendance dashboard to allow the operations team to accurately update attendance status as needed.
When you are thinking about data design, a good question to ask is “Can this data be changed by anyone?” And as a follow-on “If this data is changed, what will the impact be on the results?” No matter what the organizational policies are, if data can be changed, it most likely will be at some point. Understanding the possibilities and possible side-effects can allow you to create a design that will mitigate the impact.
Are we all thinking the same thing?
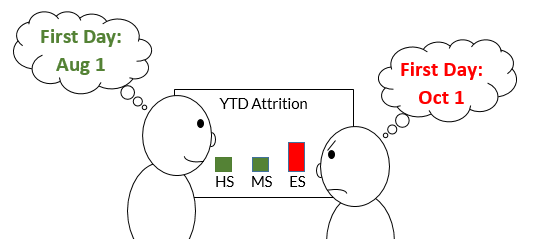
The enrollment and attrition dashboard was ready after undergoing extensive review. The morning it was released, it became apparent that something was wrong. The year-to-date attrition numbers for the elementary schools did not match what the school principals expected to see based on their own calculations.
It all hinged on everyone’s definition of “the first day of school.” Year-to-date attrition was based on the number of students enrolled on the first day versus the current date. The dashboard was using the official school first day from the beginning of the school year. The elementary schools were using an official first day set by the district’s city and chosen to avoid the high level of enrollment churn that can take place at the beginning of the school year. Once the dashboard was adjusted to use different first days for different school levels, everyone was happy.
A data design project should include subject matter experts (SMEs) who understand the use cases for each of the data points being presented. If the data is derived from different groups or departments across an organization, it’s important to have SME representation from each one, even if it seems like everyone’s expectations will be the same. It’s also important to explicitly define the key data points and vet the definitions with all of the SMEs and stakeholders to ensure that any critical differences are identified and accounted for in the project design.
Data Analytics Issues: In Summary…
Being mindful of the ways that data sources and systems outside of your control can impact your warehouse can help you plan for and even prevent data discrepancies and outages. Making sure that all the right people are involved in the data design process, and that everyone is thinking about use cases at points in time throughout the cycle of a year will help you develop more successful solutions.
Unicon has a wide range of experience with data analytics through projects such as this one. We can help you anticipate trouble areas and think through data design issues to make your data journey a lot easier!